Adiyogi Trend🟢🔴 “Adiyogi” Trend — Market Alignment Visualizer
“Adiyogi” Trend is a powerful, non-intrusive trend detection system built for traders who seek clarity, discipline, and alignment with true market flow. Inspired by the meditative stillness of Adiyogi and the need for mindful, high-probability decisions, this tool offers a clean and intuitive visual guide to trending environments — without cluttering the chart or pushing forced trades.
This is not a buy/sell signal generator. Instead, it is designed as a background confirmation engine that helps you stay on the right side of the market by identifying moments of true directional strength.
🧠 Core Logic
The “Adiyogi” Trend indicator highlights the background of your chart in green or red when multiple layers of strength and structure align — including momentum, market positioning, and relative force. Only when these internal components agree does the system activate a directional state.
It’s built on three foundational energies of trend confirmation:
Strength of movement
Structure in price action
Conviction in momentum
By combining these into one visual background, the indicator filters out indecision and helps you stay focused during real trend phases — whether you're day trading, swing trading, or holding longer-term positions.
📌 Core Concepts Behind the Tool
The indicator integrates three essential market filters—each confirming a different dimension of trend strength:
ADX (Average Directional Index) – Measures trend momentum.
You’ve chosen a very responsive setting (ADX Length = 2), which helps catch the earliest possible signs of momentum emergence.
The threshold is ADX ≥ 22, ensuring that weak or sideways markets are filtered out.
SuperTrend (10,1) – Captures short-term trend direction.
This setup follows price closely and reacts quickly to reversals, making it ideal for fast-moving assets or intraday strategies.
SuperTrend acts as the structural confirmation of directional bias.
RSI (Relative Strength Index) – Measures strength based on recent price closes.
You’ve configured RSI > 50 for bullish zones and < 50 for bearish—a neutral midpoint standard often used by professional traders.
This ensures that only trades in sync with momentum and recent strength are highlighted.
🌈 How It Visually Works
Background turns GREEN when:
ADX ≥ 22, indicating strong momentum
Price is above the 20 EMA and above SuperTrend (10,1)
RSI > 50, confirming recent strength
Background turns RED when:
ADX ≥ 22, indicating strong momentum
Price is below the 20 EMA and below SuperTrend (10,1)
RSI < 50, confirming recent weakness
The background remains neutral (transparent) when trend conditions are not clearly aligned—this is the tool's way of keeping you out of indecisive markets.
A label (BULL / BEAR) appears only when the bias flips from the previous one. This helps avoid repeated or redundant alerts, focusing your attention only when something changes.
📊 Practical Uses & Benefits
✅ Stay with the trend: Perfectly filters out choppy or sideways markets by only activating when conditions align across momentum, structure, and strength.
✅ Pre-trade confirmation: Use this tool to confirm trade setups from other indicators or price action patterns.
✅ Avoid noise: Prevent overtrading by focusing only on high-quality trend conditions.
✅ Visual clarity: Unlike arrows or plots that clutter the chart, this tool subtly highlights trend conditions in the background, preserving your price action view.
📍 Important Notes
This is not a buy/sell signal generator. It is a trend-confirmation system.
Use it in conjunction with your existing entry setups—such as breakouts, order blocks, retests, or candlestick patterns.
The tool helps you stay in sync with the dominant direction, especially when combining multiple timeframes.
Can be used on any market (stocks, forex, crypto, indices) and on any timeframe.
Search in scripts for "Buy sell"

ANDROMEDA - TrendSyncANDROMEDA - TrendSync
Pedro Canto - Portfolio Manager | CGA/CGE
OVERVIEW
Trend Sync is a multi-layered trend-following indicator designed to help traders identify high-probability trend continuation setups while avoiding low-quality entries caused by overbought or oversold market conditions.
This indicator combines the power of Moving Averages (MA), MACD , and a visual RSI-based filter to validate both trend direction and timing for entries. It's goal is simple: filter out noise and highlight only the most technically relevant buy and sell signals based on objective momentum and trend criteria.
---
WALKTHROUGH
This indicator is built for traders seeking to operate in the direction of established trends. It's core principle is to identify and validate current trend conditions, and then signal entry opportunities during pullbacks to key moving averages.
Trend identification is achieved through the alignment of two moving averages. When these MAs are crossed and angled in the same direction, they confirm that a trend is in progress. To double-confirm trend direction, the MACD histogram is used—only. When both the MAs and MACD are aligned in the same direction, then the trend is considered valid.
Once all trend criteria are met, a dynamic coloring system is activated to visually reinforce the trend across the candles and moving averages.
To avoid poor entries during market exhaustion, an RSI-based filter is used. This short-term RSI highlights overbought or oversold zones, helping traders filter trades in extreme price conditions.
Only when the trend is validated and price pulls back to one of the MAs will a buy/sell signal be triggered, aligning momentum, price action and timing into a single actionable setup.
This combination ensures that each component plays a specific role:
i) Moving Averages define the trend
ii) MACD validates it
iii) RSI filters noise
iv) Intrabar price action triggers entries
This synchronism helps improve decision-making and entry timing, especially for swing and intraday traders.
---
USE CASES
- Identifying trend continuation setups
- Filtering false signals during consolidation phases
- Avoiding trades in overbought or oversold zones
- Enhancing entry timing for both swing and intraday strategies
- Providing visual confirmation of trend strength and momentum alignment
---
KEY FEATURES
1. Dual Moving Average Setup
The indicator allows full customization of two moving averages (MA1 and MA2), supporting both EMA and SMA types. The slope of the longer MA (MA2) acts as an essential trend filter, ensuring signals are only generated when the market shows clear directional bias.
2. MACD Histogram Trend Confirmation
A classic MACD Histogram calculation is used to validate the momentum of the prevailing trend.
- Bullish Trend: Histogram > 0
- Bearish Trend: Histogram < 0
This step filters out counter-trend signals and ensures trades are aligned with momentum.
3. Intrabar Price Trigger
Unlike standard crossover systems, this indicator waits for intrabar price action to trigger entries:
- Buy Signal: Price crosses below one of the MAs during an uptrend (dip-buy logic)
- Sell Signal: Price crosses above one of the MAs during a downtrend (rally-sell logic)
This intrabar trigger improves entry timing and helps capture retracement-based opportunities.
4. RSI Visual Filter
A short-term RSI is plotted and color-coded to visually highlight overbought and oversold conditions, acting as a discretionary filter for users to avoid low-probability trades during exhaustion points.
5. Dynamic Coloring System
Bar Colors:
- Blue: Bullish trend
- Red: Bearish trend
- Orange: RSI Overbought/Oversold zones
MA Colors:
- Blue for bullish conditions
- Red for bearish conditions
- Gray for neutral/no-trend phases
6. Signal Markers and Alerts
Clear visual buy and sell markers are plotted directly on the chart.
Additionally, the indicator includes real-time alerts for both Buy and Sell signals, helping traders stay informed even when away from the screen.
---
INPUTS AND CUSTOMIZATION OPTIONS
- Moving Average Types: EMA or SMA for both MA1 and MA2.
- MACD Settings: Customizable fast, slow, and signal periods.
- RSI Settings: Source, length, and overbought/oversold levels fully adjustable.
- Color Customization: Adjust RSI zone colors to suit your chart theme.
---
DISCLAIMER
This indicator is a technical analysis tool designed for educational and informational purposes only. It should not be used as a standalone trading system. Always combine it with sound risk management, price action analysis, and, where applicable, fundamental context.
Past performance does not guarantee future results.

Future is hereOverview
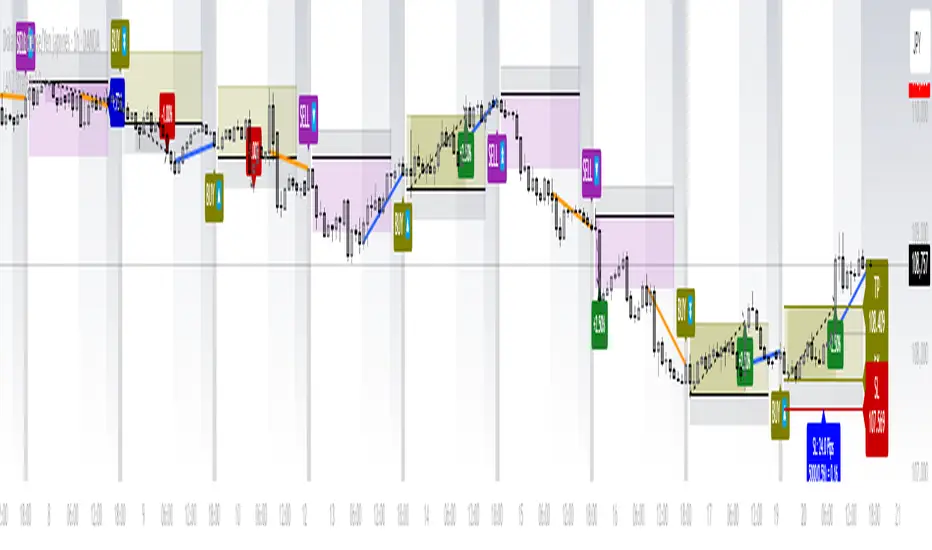
"Future is Here" is an original, multi-faceted Pine Script indicator designed to provide traders with a comprehensive toolset for identifying high-probability trading opportunities. By integrating volatility-based entry zones, trend-based price targets, momentum confirmation, dynamic support/resistance levels, and risk-reward ratio (RRR) calculations, this indicator offers a cohesive and actionable trading framework. Each feature is carefully designed to complement the others, ensuring a synergistic approach that enhances decision-making across various market conditions. This script is unique in its ability to combine these elements into a single, streamlined interface with clear visual cues and customizable alerts, making it suitable for both novice and experienced traders.
Key Features and How They Work Together
Volatility-Based Entry Zones
Purpose: Identifies overbought and oversold conditions using a volatility-adjusted moving average, helping traders spot potential reversal zones.
Mechanism: Utilizes a user-defined volatility length and multiplier to calculate dynamic overbought/oversold thresholds based on the standard deviation of price. Crossovers and crossunders of these levels trigger "Buy Zone" or "Sell Zone" labels.
Synergy: These zones act as the foundation for entry signals, which are later confirmed by momentum and trend filters to reduce false signals.
Trend-Based Price Targets
Purpose: Projects potential price targets based on the prevailing trend, giving traders clear objectives for profit-taking.
Mechanism: Combines a fast and slow moving average to determine trend direction, then calculates target prices using a multiplier of the price deviation from the slow MA. Labels display bullish or bearish targets when the fast MA crosses the slow MA.
Synergy: Works in tandem with entry zones and momentum signals to align targets with market conditions, ensuring traders aim for realistic price levels supported by trend strength.
Momentum Confirmation
Purpose: Validates entry signals by assessing momentum strength, filtering out weak setups.
Mechanism: Uses the momentum indicator to detect bullish or bearish momentum crossovers, labeling them as "Strong" or "Weak" based on a comparison with a smoothed momentum average.
Synergy: Enhances the reliability of buy/sell signals by ensuring momentum aligns with volatility zones and trend direction, reducing the risk of premature entries.
Dynamic Support/Resistance Levels
Purpose: Highlights key price levels where the market is likely to react, aiding in trade planning and risk management.
Mechanism: Detects pivot highs and lows over a user-defined lookback period, drawing horizontal lines for the most recent support and resistance levels (limited to two each for clarity). Labels mark these levels with price values.
Synergy: Complements entry zones and price targets by providing context for potential reversal or continuation points, helping traders set logical stop-losses or take-profits.
Buy/Sell Signals with Risk-Reward Ratios
Purpose: Generates precise buy/sell signals with integrated take-profit (TP), stop-loss (SL), and RRR calculations for disciplined trading.
Mechanism: Combines volatility zone crossovers, trend confirmation, and positive momentum to trigger signals. ATR-based TP and SL levels are calculated, and the RRR is displayed in labels for quick assessment.
Synergy: This feature ties together all previous components, ensuring signals are only generated when volatility, trend, and momentum align, while providing clear risk-reward metrics for trade evaluation.
Customizable Alerts
Purpose: Enables traders to stay informed of trading opportunities without constant chart monitoring.
Mechanism: Alert conditions are set for buy and sell signals, delivering notifications with the entry price for seamless integration into trading workflows.
Synergy: Enhances usability by allowing traders to act on high-probability setups identified by the indicator’s combined logic.
Originality
"Future is Here" is an original creation that distinguishes itself through its holistic approach to technical analysis. Unlike single-purpose indicators, it integrates volatility, trend, momentum, and support/resistance into a unified system, reducing the need for multiple scripts. The inclusion of RRR calculations directly in signal labels is a unique feature that empowers traders to evaluate trade quality instantly. The script’s design emphasizes clarity and efficiency, with cooldowns to prevent label clutter and a limit on support/resistance lines to maintain chart readability. This combination of features, along with its customizable parameters, makes it a versatile and novel tool for traders seeking a robust, all-in-one solution.
How to Use
Setup: Add the indicator to your TradingView chart and adjust input parameters (e.g., Volatility Length, Trend Length, TP/SL Multipliers) to suit your trading style and timeframe.
Interpretation:
Look for "Buy Zone" or "Sell Zone" labels to identify potential entry points.
Confirm entries with "Bull Mom" or "Bear Mom" labels and trend direction (Bull/Bear Target labels).
Use Support/Resistance lines to set logical TP/SL levels or anticipate reversals.
Evaluate Buy/Sell signals with TP, SL, and RRR for high-probability trades.
Alerts: Set up alerts for Buy/Sell signals to receive real-time notifications.
Customization: Fine-tune multipliers and lengths to adapt the indicator to different markets (e.g., stocks, forex, crypto) or timeframes.

ALP AT + KAMA Crossover This indicator is a powerful combination of two adaptive trend-following concepts: the AlphaTrend by Kivanc Ozbilgic and the Kaufman's Adaptive Moving Average (KAMA), often credited to Perry Kaufman (with the specific implementation based on HPotter's interpretation of KAMA).
The primary goal of this indicator is to provide a robust trend detection and dynamic support/resistance system, adapting to market volatility.
How it Works:
AlphaTrend Component: The green/red line is the AlphaTrend. It dynamically adjusts to market volatility (using ATR) and momentum (using MFI or RSI, configurable). It provides faster signals for trend changes.
KAMA Component: The black line is the Kaufman's Adaptive Moving Average. KAMA is designed to filter out market noise during choppy periods and follow the price closely during trending periods, making it a smoother and more reliable long-term trend indicator.
Color-Coded Trend Zones: The AlphaTrend line is color-coded to visually represent the current market condition based on the price's position relative to both AlphaTrend and KAMA:
Strong Uptrend (Lime Green): Price is above both AlphaTrend and KAMA.
Strong Downtrend (Red): Price is below both AlphaTrend and KAMA.
Uptrend Uncertainty (Orange): Price is above KAMA but below AlphaTrend (suggests consolidation or weakening uptrend).
Downtrend Uncertainty (Blue): Price is below KAMA but above AlphaTrend (suggests consolidation or strengthening downtrend within a downtrend).
Gray: Default/unclassified state.
The underlying logic is based on:
Bullish Crossover (Potential Buy Signal): When the AlphaTrend line crosses above the KAMA line.
Bearish Crossover (Potential Sell Signal): When the AlphaTrend line crosses below the KAMA line.
These crossovers indicate a shift in the adaptive trend momentum.
Customization:
Users can customize various parameters in the indicator's settings, including:
AlphaTrend Multiplier and Common Period.
KAMA Lengths and Alpha values.
All the color codes for different trend zones and lines, allowing for full personalization of the visual output.
Disclaimer:
This indicator is for informational and educational purposes only and should not be considered as financial advice. Trading involves substantial risk, and past performance is not indicative of future results. Always conduct your own thorough research and analysis before making any trading or investment decisions. This indicator is NOT a buy/sell/hold recommendation. Use it as a tool to aid your analysis, not as a sole basis for your trades.

CVD Strength | VTS Pro🔷 CVD Strength | VTS Pro
By Alireza Mossaheb
Description:
CVD Strength is a powerful tool designed to analyze market momentum by visualizing the Cumulative Volume Delta (CVD) using advanced techniques. This indicator provides a multi-timeframe view of volume delta behavior and highlights strong and weak bullish/bearish conditions based on volume spikes, candle size, and optional moving average filters.
Key Features:
Multi-timeframe CVD candle plotting with color-coded strength signals
Optional EMA (21), WMA (30), and SMA (50) overlays for trend filtering
Smart strength detection logic using volume, candle size, and moving average crossovers
Bullish and bearish crossover signals marked on chart
Customizable anchor and lower timeframes for flexible analysis
Alerts users when data vendor does not supply volume information
This script is particularly useful for identifying institutional buying/selling pressure and can be used effectively in both trend-following and mean-reversion strategies.

LANZ Strategy 1.0🔷 LANZ Strategy 1.0 — Session-Based Directional Logic with Visual Multi-Account Risk Management
LANZ Strategy 1.0 is a structured and disciplined trading strategy designed for the 1-hour timeframe, operating during the NY session and executing trades overnight. It uses the directional behavior between 08:00 and 18:00 New York time to define precise limit entries for the following night. Ideal for traders who prefer time-based execution, clear visuals, and professional risk management across multiple accounts.
🧠 Core Components:
1. Session Direction Confirmation:
At 18:00 NY, the system evaluates the market direction by comparing the open at 08:00 vs the close at 18:00:
If the direction matches the previous day, it is reversed.
If it differs, the current day’s direction is kept.
This logic is designed to avoid trend exhaustion and favor potential reversal opportunities.
2. EP Level & Risk Definition:
Once direction is defined:
For BUY, EP is set at the Low of the session.
For SELL, EP is set at the High of the session.
The system automatically plots:
SL fixed at 18 pips from EP
TP at 3.00× the risk → 54 pips from EP
All levels (EP, SL, TP) are shown with visual lines and price labels.
3. Time-Restricted Entry Execution:
The entry is only valid if price touches the EP between 19:00 and 08:00 NY.
If EP is not touched before 08:00 NY, the trade is automatically cancelled.
4. Multi-Account Lot Sizing:
Traders can configure up to five different accounts, each with its own capital and risk percentage.
The system calculates and displays the lot size per account, based on SL distance and pip value, in a dynamic floating label.
5. Outcome Tracking:
If TP is hit, a +3.00% profit label is displayed along with a congratulatory alert.
If SL is hit, a -1.00% label appears with a loss alert.
If the trade is still open by 09:00 NY, it is manually closed, and the result is shown as a percentage of the initial risk.
📊 Visual Features:
Custom-colored angle and guide lines.
Dynamic angle line starts at 08:00 NY and tracks price until 18:00.
Shaded backgrounds for key time zones (e.g., 08:00, 18:00, 19:00).
BUY/SELL signals shown at 19:00 based on match/divergence logic.
Label panel showing risk metrics and lot size for each active account.
⚙️ How It Works:
08:00 NY: Marks the session open and initiates a dynamic angle line.
18:00 NY: Evaluates the session direction and calculates EP/SL/TP based on outcome.
19:00 NY: Activates limit order monitoring.
During the night (until 08:00 NY): If EP is touched, the trade is triggered.
At 08:00 NY: If no touch occurred, trade is cancelled.
Overnight: TP/SL logic is enforced, showing percentage outcomes.
At 09:00 NY: If still open, trade is closed manually and result is labeled visually.
🔔 Alerts:
🚀 EP execution alert when touched
💢 Stop Loss hit alert
⚡ Take Profit hit alert
✅ Manual close at 09:00 NY with performance result
🔔 Daily reminder at 19:00 NY to configure and prepare the trade
📝 Notes:
Strategy is exclusive to the 1-hour timeframe.
Works best on assets with clean NY session movement.
Perfect for structured, semi-automated swing/overnight trading styles.
Fully visual, self-explanatory, and backtest-friendly.
👨💻 Credits:
Developed by LANZ
A strategy created with precision, discipline, and a vision for traders who value time-based entries, clean execution logic, and visual confidence on the chart.
Special thanks to Kairos — your AI assistant — for the detailed structure, scripting, and documentation of the strategy.
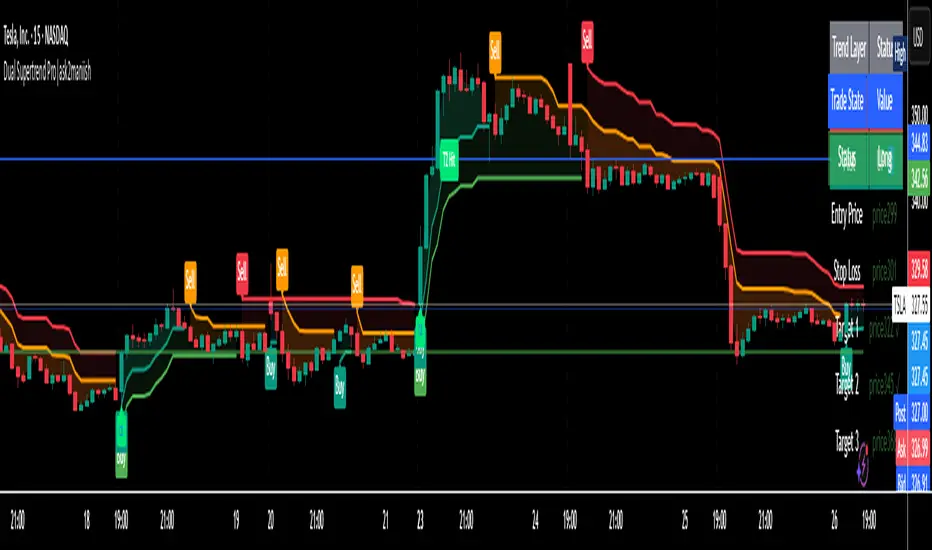
Dual Supertrend Pro|ask2maniishDual Supertrend | ask2maniish
🔍 Overview
The Dual Supertrend indicator overlays two distinct Supertrend layers (Main & Fast) to deliver enhanced trend detection, signal filtering, and trade management. It combines traditional ATR-based trend logic with an optional dynamic risk model and visual trade tracking tools — ideal for intraday scalping, swing trading, or institutional-style strategies.
⚙️ Key Features
🔁 Dual Supertrend Logic: Combines a Main and Fast Supertrend for multi-layer confirmation.
🧠 Smart Entry Signals: Generates buy/sell signals only when both layers agree (combined confirmation).
🎯 Dynamic Trade Management:
Entry/SL/Target logic using ATR.
Auto Breakeven, Trailing SL, and Exit after Target 3.
📊 Trade State Dashboard:
On-chart table showing live status, targets, and trade side.
Visual labels for entry, SL hit, and each target.
🧾 Tooltip for SL Settings: Detailed ATR configurations based on strategy style (Scalping, Swing, Institutional, etc.).
🧠 Use Cases
Strategy Type ATR Period Multiplier Notes
Conservative Trading 14 1.0 – 1.5× Balanced, avoids whipsaws, better R:R
Volatile Markets 21 1.5 – 2.5× For crypto, indices, strong trends
Intraday Scalping 5 – 10 0.5 – 1.0× Tighter SLs for rapid trades
Swing Trades 14 – 21 1.5 – 3.0× Handles spikes, rides long trends
Institutional Logic Dynamic 1.5× below OB SL below CHoCH or Order Block structure zones
You can view this tooltip in the Trade Management group inputs.
🧰 Inputs
📌 Supertrend (Main)
ATR Period
ATR Multiplier
ATR Method (SMA/True Range)
Signal Toggle
Highlight Toggle
⚡ Supertrend (Fast)
ATR Period (Shorter)
ATR Multiplier (Smaller)
ATR Method (SMA/True Range)
Signal Toggle
Highlight Toggle
🎯 Trade Management
SL & Target ATR Period
Target Multiplier
Auto Exit after Target 3
Entry/Exit Label Toggle
Target Hit Label Toggle
Show SL/Target Lines
🧮 Trend State Table
Location Selectable
Combined Trend Label: Strong Up 🔼 / Down 🔽 / Mixed ⚠️
📈 Signals & Alerts
Trigger alerts for all the following:
Main Supertrend Buy/Sell
Fast Supertrend Buy/Sell
Confirmed Combined Buy/Sell when both layers align
📊 Visualization
📉 Supertrend bands with optional background fill
✅ Entry label with trend direction
🎯 Target hit labels with color-coded levels
🧾 Trade Dashboard with real-time trade info
📌 Best Practices
Use combined signals (CB, CS) for filtered trend entries.
Adjust ATR multiplier based on market volatility.
Use in confluence with SMC, OB, or CHoCH zones for higher accuracy.
Enable trade table for real-time tracking of SL and targets.
👨💻 Credits
Script developed by @ask2maniish, with adaptive trade logic and dual-layer Supertrend logic optimized for precision entries and automated exits.
Bid/Ask Volume Tension with Rolling Avg📊 Bid/Ask Volume Tension with Rolling Average
This indicator is designed to help traders identify pivotal moments of buildup, exhaustion, or imbalance in the market by calculating the tension between buy and sell volume.
🔍 How It Works:
Buy volume is approximated when the candle closes higher than or equal to its open.
Sell volume is approximated when the candle closes below its open.
Both are smoothed using an EMA (Exponential Moving Average) for noise reduction.
Tension is calculated as the absolute difference between smoothed buy and sell volume.
A rolling average of tension shows the baseline for normal behavior.
When instant tension rises significantly above the rolling average, it often signals:
A build-up before a large move
Aggressive order flow imbalances
Potential reversals or breakouts
🧠 How to Use:
Watch the orange line (instant tension) for spikes above the aqua line (rolling average).
Purple background highlights show when tension exceeds a customizable multiple of the average — a potential setup zone.
Use this indicator alongside:
Price action (candlestick structure)
Support/resistance
Liquidity zones or order blocks
⚙️ Settings:
Smoothing Length: Controls the responsiveness of buy/sell volume smoothing.
Rolling Avg Window: Defines the lookback period for the baseline tension.
Buildup Threshold: Triggers highlight zones when tension exceeds this multiple of the average.
🧪 Best For:
Spotting pre-breakout tension
Detecting volume-based divergences
Confirming order flow imbalances

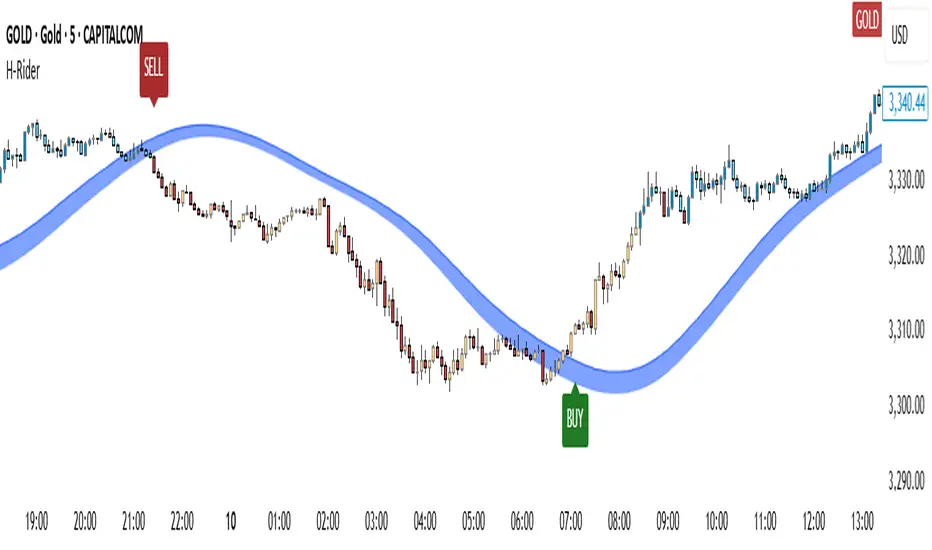
Heikin RiderHeikin Rider
Smoothed Heikin Ashi Breakout Signals with Flow Confirmation
by Ben Deharde, 2025
Overview:
Heikin Rider is a trend-following indicator that detects clean breakout signals using a custom smoothed Heikin Ashi wave (the H-Wave) with optional confirmation from a flow-based filter. It's designed for traders who want precise, momentum-aligned entries.
What It Does:
Plots dynamic high/low bands from smoothed Heikin Ashi candles.
Triggers Buy/Sell signals on full candle breakouts above/below the wave.
Colors bars based on price position and momentum relative to a custom flow line.
Optionally filters signals based on flow direction.
How the H-Wave Works:
The H-Wave is a two-stage smoothed Heikin Ashi construction:
Pre-smoothing: Price is smoothed using a short-length MA (SMA, EMA, or HMA).
HA Calculation: Heikin Ashi values are calculated from the smoothed data.
Post-smoothing: A second, longer MA is applied to the HA values.
Wave Envelope: The high and low wicks of the final smoothed HA candles form the H-Wave envelope.
Signals are generated when price fully breaks this envelope, with optional confirmation from the flow color.
Inputs:
Trend timeframe
Pre/Post smoothing type and length
Flow MA type and length
Toggle for bar coloring and signal filtering
Notes:
Built with original logic, using the open-source TAExt library (credited).
No repainting — all signals are confirmed at close.
For use on standard candles only (not HA or Renko).
Alerts:
Long Signal (Buy)
Short Signal (Sell)
Contrarian with 5 Levels5 Levels application was inspired and adapted from Predictive Ranges indicator developed by Lux Algo. So much credit to their work.
Indicator Description: Contrarian with 5 Levels
Overview
The "Contrarian with 5 Levels" indicator is a powerful tool designed for traders seeking to identify potential reversal points in the market by combining contrarian trading principles with dynamic support and resistance levels. This indicator overlays a Simple Moving Average (SMA) shadow and five adaptive price levels, integrating Institutional Concepts of Structure (ICT) such as Break of Structure (BOS) and Market Structure Shift (MSS) to provide clear buy and sell signals. It is ideal for traders looking to capitalize on overextended price movements, particularly on the daily timeframe, though it is adaptable to other timeframes with proper testing.
How It Works
The indicator operates on two core components:
Contrarian SMA Shadow: A shaded region between the SMA of highs and lows (default length: 100) acts as a dynamic zone to identify overbought or oversold conditions. When the price moves significantly outside this shadow, it signals potential exhaustion, aligning with contrarian trading principles.
Five Adaptive Levels: Using a modified ATR-based calculation, the indicator plots five key levels (two resistance, one average, and two support) that adjust dynamically to market volatility. These levels serve as critical zones for potential reversals.
ICT Structure Analysis: The indicator incorporates BOS and MSS logic to detect shifts in market structure, plotting bullish and bearish breaks with customizable colors for clarity.
Buy and sell signals are generated when the price crosses key levels while outside the SMA shadow, indicating potential reversal opportunities. The signals are visualized as small circles above (sell) or below (buy) the price bars, making them easy to interpret.
Mathematical Concepts
SMA Shadow: The indicator calculates the SMA of the highest highs and lowest lows over a user-defined period (default: 100). This creates a dynamic range that highlights extreme price movements, which contrarian traders often target for reversals.
Five Levels Calculation: The five levels are derived using a volatility-adjusted formula based on the Average True Range (ATR). The average level (central pivot) is calculated as a smoothed price, with two upper (resistance) and two lower (support) levels offset by a multiple of the ATR (default multiplier: 6.0). This adaptive approach ensures the levels remain relevant across varying market conditions.
ICT BOS/MSS Logic: The indicator identifies pivot highs and lows on a user-defined timeframe (default: daily) to detect structural breaks. A BOS occurs when the price breaks a prior pivot high (bullish) or low (bearish), while an MSS signals a shift in market direction, providing context for potential reversals.
Entry and Exit Rules
Buy Signal (Blue Dot Below Bar): Triggered when the closing price is below both the SMA shadow (smaLow) and the average level (avg), and the price crosses under either the first or second support level (prS1 or prS2). This suggests the market may be oversold, indicating a potential reversal upward.
Sell Signal (White Dot Above Bar): Triggered when the closing price is above both the SMA shadow (smaHigh) and the average level (avg), and the price crosses over either the first or second resistance level (prR1 or prR2). This suggests the market may be overbought, indicating a potential reversal downward.
Recommended Usage
This indicator is optimized for the daily timeframe, where it has been designed to capture significant reversal opportunities in trending or ranging markets. However, it can be adapted to other timeframes (e.g., 1H, 4H, 15M) with proper testing of settings such as SMA length, ATR multiplier, and structure timeframe. Users are encouraged to backtest and optimize parameters to suit their trading style and asset class.
Customization Options
SMA Length: Adjust the SMA period (default: 100) to control the sensitivity of the shadow.
Five Levels Length and Multiplier: Modify the length (default: 200) and ATR multiplier (default: 6.0) to fine-tune the support/resistance levels.
Timeframe Settings: Set separate timeframes for structure analysis and five levels to align with your trading strategy.
Color and Signal Display: Customize colors for BOS/MSS lines and toggle buy/sell signals on or off for a cleaner chart.
Why Use This Indicator?
The "Contrarian with 5 Levels" indicator combines the power of contrarian trading with dynamic levels and market structure analysis, offering a unique perspective for identifying high-probability reversal setups. Its intuitive design, customizable settings, and clear signal visualization make it suitable for both novice and experienced traders. Whether you're trading forex, stocks, or cryptocurrencies, this indicator provides a robust framework for spotting potential turning points in the market.
We hope you find the "Contrarian with 5 Levels" indicator a valuable addition to your trading toolkit! Happy trading!
Please leave feedback in the comments section.

Prev Week POC Buy/Sell Signals
Hi, I’m Edward. I created a straightforward strategy for swing traders (4hr or 8hr timeframe users). This strategy is for traders that are not interested to look at charts all day long, 2 times a day max, but still be profitable.
The indicator:
Print a buy signal when the price closes above the previous week's Point of Control (POC).
Stay in the trade until the price closes below the previous week's POC, then print a sell signal.
The indicator calculates the weekly POC using a basic volume profile method, then tracks the previous week's POC for signals.
Previous week POC is valid from Monday to Thursday. By close of business on Thursday, the current week trend and POC should be well established and should be used make buy or sell decisions. Enjoy!

DP_MoneyFlow_Osc_V4**DP_Moneyflow_Osc_V4** is a custom, volume‐weighted momentum oscillator built around the classic Money Flow Index (MFI), with a few twists to help you spot more reliable reversal points:
***Best way to use it is to take the signals as alert points, to understand when money is starting to flow in or starting to flow out. It is not intended to be a Buy or Sell signal at the point of entry where the label is printed.***
1. **Core Calculation**
* Computes the standard MFI on your chart’s native timeframe:
* Money Flow = typical price (H+L+C)/3 × volume
* Segregates positive vs. negative flow based on whether price rose or fell on each bar
* Smooths each with an N-bar SMA, forms the ratio, and maps it into a 0–100 scale
2. **Inversion & Smoothing**
* You can **invert** the oscillator around 50 (so peaks become troughs and vice versa) with the **Reverse MFI** toggle.
* Applies two layers of smoothing (one for raw noise reduction, another for longer-term trend stability).
3. **Dynamic Coloring**
* Above Overbought (OB) threshold → solid red; below Oversold (OS) → solid green.
* In between, it linearly fades from red/green toward black as it approaches the 50 midpoint.
* **Invert Colors** flips the hue logic (red ↔ green) if you prefer.
4. **Overbought/Oversold Zones**
* Plots horizontal lines at your chosen OB/OS levels.
* Optionally fills the zone between them for quick visual reference.
5. **Peak/Trough Signal Labels**
* Detects **true extremes** by finding when the oscillator reverses direction right at or beyond your OB/OS levels.
* Prints a tiny “OB” or “OS” label **exactly at that pivot bar**, so you see the high or low of the swing.
6. **Alternation Toggle**
* Prevents two consecutive “OS” or “OB” labels by enforcing strict Buy/Sell alternation—turn this on or off via **Enable Signal Alternation**.
---
**Use-Case**: This oscillator excels at pinpointing the *tops* and *bottoms* of strong volume‐backed moves, giving you clear pivot markers rather than every threshold crossover. Tweak the smoothing and threshold inputs to calibrate sensitivity to your market and timeframe.

SuperTrend Adaptive (STD Smooth)Supertrend Adaptive (Smoothed StdDev)
Supertrend Adaptive is a refined trend-following indicator based on the classic Supertrend. It enhances the original by incorporating smoothed standard deviation into the volatility calculation, instead of relying solely on ATR. This hybrid approach enables more responsive and adaptive trend detection, reducing noise and false signals in volatile or ranging markets. The indicator also features confidence-weighted signal labels and a clean, uncluttered display, making it practical for any trading timeframe.
🔍 Detailed Methodology and Conceptual Foundation
Unlike traditional Supertrend indicators that use only absolute volatility (ATR) to define trend bands, this version blends standard deviation — a relative volatility measure — into the calculation. Standard deviation helps capture the dispersion of price, not just its range, and when smoothed, it filters out erratic jumps caused by sudden spikes or drops.
This fusion creates trend bands that expand and contract dynamically based on recent price variability. As a result:
Fewer whipsaws : The trend bands adjust to both low and high volatility environments, which helps avoid unnecessary signal flips during consolidation.
Stronger trend adherence : Signals are less reactive to momentary price movements. This allows the indicator to hold positions longer in trending markets, giving traders the opportunity to ride extended moves.
Bollinger Band-style adaptation : By including standard deviation, this indicator behaves similarly to Bollinger Bands — accounting for relative price change rather than absolute moves alone.
These enhancements make the tool suitable not only for identifying directional bias, but also for refining entries and exits with more context-aware volatility filtering.
📈 How to Use the Indicator
Trend Direction: The script draws a colored line beneath (uptrend) or above (downtrend) price. Green indicates bullish trend, red indicates bearish.
Buy/Sell Labels: Only the most recent signal is shown to reduce clutter:
🟢 Green "Buy" label = trend reversal to bullish, with strong confidence.
🔵 Blue "Buy" label = same reversal, but with lower volume confidence.
🔴 Red "Sell" label = trend reversal to bearish, with strong confidence.
🟠 Orange "Sell" label = bearish signal with lower volume confidence.
These color codes are derived from comparing current volume to its average — a higher-than-average volume gives greater confidence to the signal.
Settings:
ATR Period: Controls the smoothing window for volatility calculation.
ATR Multiplier: Adjusts the size of the trend bands.
Std Smooth: Controls smoothing applied to standard deviation to reduce jitter.
Change ATR Method: Option to toggle between default and smoothed ATR.
Show Signals: Toggle for label display.
📢 Alerts
The script includes three built-in alert conditions:
Buy Signal: Triggered when the trend flips to bullish.
Sell Signal: Triggered when the trend flips to bearish.
Trend Direction Change: Alerts on any switch in trend regardless of confidence level.
These alerts allow traders to automate notifications or integrations with bots or trading platforms.
🧼 Clean Chart Display
To ensure clarity and comply with best practices:
The chart shows only this indicator.
Trend lines are drawn in real time for visual context.
Only one label per direction is shown — the most recent one — to keep the chart readable.
No drawings or unrelated indicators are included.
This setup ensures the script’s signals and structure are immediately understandable at a glance.
📌 Best Use Cases
This tool is designed for:
Traders who want adaptive volatility filters instead of rigid ATR-based models.
Scalpers and swing traders who prefer clean charts with minimal lag and fewer false signals.
Any asset class — works well on crypto, FX, and equities.
Shortcoming of this tool is sideway price action (will be tackled in next versions).
Credit for www.tradingview.com the version which this script extends.

Intraday Volume by Saurabh Maggoinspired by volume indicator by nitin
Key Features
Dynamic Volume Visualization: Features thicker volume bars with color-coded insights—grey for normal volume (0.5x-1.5x baseline), orange for low volume (<0.5x), blue for Intraday Pocket Pivots (IPP), green for high up volume, and red for high down volume.
Snort Signals: Identifies strong moves with green Bull Snorts (below bars) and red Bear Snorts (above bars), triggered by volume exceeding 2.0x the baseline with significant price action.
Highest/Lowest Volume Markers: Blue squares mark the highest volume bar, and a single orange square marks the first lowest volume bar, aiding trend identification.
Enhanced Table Metrics: A 2x3 table displays Trend Strength (TS, green >100%, red <100%), Buy/Sell Signal (BS, green "Buy", red "Sell", grey "Neutral"), and Net Pressure (NP, green >0%, red <0%), offering a comprehensive view of volume and price pressure, reset daily at 9:15 AM IST.

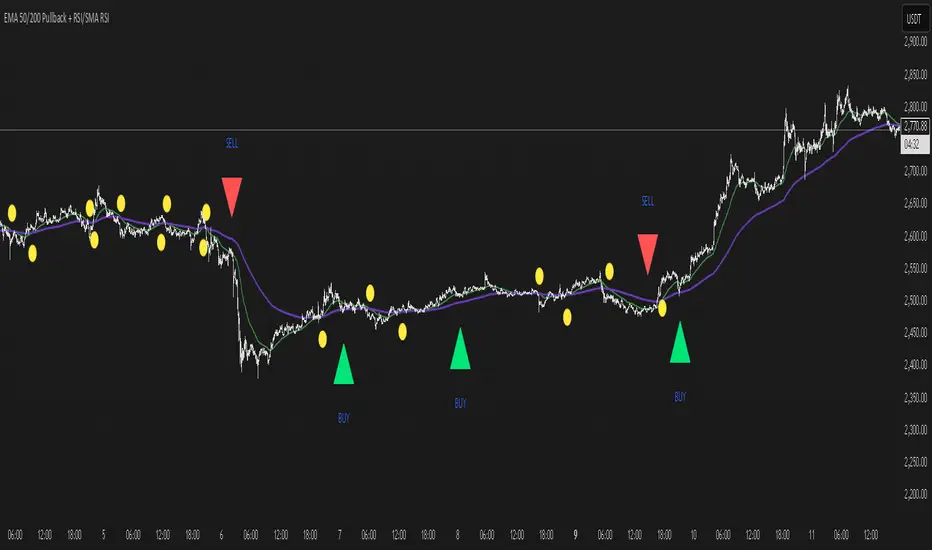
EMA 50/200 Pullback + RSI/SMA RSI
Strategy Description: EMA 50/200 Pullback + RSI/SMA RSI
1. Trend Identification with EMA:
Uses two Exponential Moving Averages (EMA): a fast EMA (default 50) and a slow EMA (default 200).
When the fast EMA crosses above the slow EMA (bullish crossover), an uptrend is identified.
When the fast EMA crosses below the slow EMA (bearish crossover), a downtrend is identified.
The lengths of both EMAs are fully customizable.
2. EMA Distance Condition:
Signals are only valid when the absolute percentage distance between the two EMAs is within a user-defined range (default: 0.4% to 1%).
This helps filter out weak signals when the EMAs are too close or too far apart.
3. Pullback Condition:
After a new trend is detected (EMA crossover), the strategy waits for the price to pull back to touch or cross the fast EMA (EMA 50).
This ensures entries are not taken immediately at the crossover, but after a retracement to a dynamic support/resistance area.
4. RSI Confirmation:
Uses the RSI indicator (default 14) and its Simple Moving Average (SMA RSI, default 14).
Buy signal: RSI crosses above its SMA.
Sell signal: RSI crosses below its SMA.
Both RSI and SMA RSI lengths are fully customizable.
5. Entry Rules:
The indicator only gives the first buy/sell signal after each EMA crossover (start of a new trend), and will not repeat signals until the next EMA crossover.
Buy signal:
Fast EMA crosses above slow EMA
EMA distance is within the valid range
Price pulls back to the fast EMA
RSI crosses above its SMA
Sell signal:
Fast EMA crosses below slow EMA
EMA distance is within the valid range
Price pulls back to the fast EMA
RSI crosses below its SMA
6. Customization:
All parameters (EMA lengths, RSI length, SMA RSI length, EMA distance range) can be adjusted in the indicator’s settings.
Note:
This is a signal indicator, not a complete trading strategy. For real trading, always combine with risk management and additional confirmations.
4-EMA Signals + MTF Analysis4-EMA Signals + MTF Analysis Indicator: User Guide
This indicator is designed for active traders; from scalpers / intra-day traders to swing-traders who simply want an easy to understand, simple, but yet comprehensive and easy-to-understand indicator with a quick overview of initial market momentum and overall market direction to assist the trader in their initial trading.
The main feature of this indicator is that It overlays four exponential moving averages (EMAs), and provides a dashboard of real-time trend signals for both buy and sell (long/short) scenarios.
Settings Overview
MA Period Setup
Custom: Set your own EMA periods.
Conservative, Aggressive, Fibonacci: Quickly apply preset EMA period combinations for different trading styles.
EMA Periods (Custom Setup)
Fast EMA: Shortest EMA, reacts quickly to price (default 7).
Medium-Short EMA: Intermediate speed (default 25).
Medium-Long EMA: Slower, filters out more noise (default 70).
Slow EMA: Longest-term trend (default 200).
(These settings can be adjusted to suit your individual needs)
Main Indicator Features
Four EMAs : Plotted in distinct colors (green, yellow, orange, red) for quick trend recognition - this can be altered in colour to your personal preferences.
Buy/Sell Signals : Triangles appear below/above bars when EMA crossovers occur, optionally filtered by volume - the volume filter when applied greatly reduces the influx of signals, only giving high-quality signals!
Trading Sessions + Backgrounds : A trading session feature has been added: (London, New York, Asia, Sydney) with the choice of a background to indicate each global trading session.
Volume Overlay : Volume bars and a blue volume moving average line for context.
Dashboard Table (Top Right):
Market Direction: Shows the overall EMA alignment (bullish, bearish, weak, consolidating).
The initial trend on the 5m, 15m, 1H, and 4H time-frame to give a quick snapshot of overall trend direction.
How to Use
Trend Identification :
-- Use the EMA alignment and dashboard table to quickly see if the market is bullish, bearish, or consolidating.
EMA Set-up
-- Adjust the EMA settings to your specific requirements, the signals will alter depending on the volatility of the instrument your trading.
Signal Confirmation :
-- ''Buy'' signals simply appear when the faster EMAs cross above slower EMAs in and ''Sell'' signals simply appear when they cross below.
Volume Context :
--Use the volume moving average and the optional volume filter to avoid signals during low-activity periods.
No Repainting :
-- All signals and dashboard readings are calculated using only confirmed, closed bars. What you see in real time is exactly what will appear in your back-test — no repainting or look-ahead bias.
Alerts / Notifications
Now for the fun part:
1. Enable Buy/Sell Signal Alerts: Get notifications when buy or sell signals occur.
2. For Alerts to function correctly, set the ''condition'' to the indicator itself.
3. Select ''EMA Bearish Cross'' or ''EMA Bullish Cross'' depending whether you want alerts for either buy/sell signals - Or one can simply set alerts for both scenarios.
4. For ''Interval'' set to ''Same as chart'' - So, the time-frame which you'd like to trade on.
5. For ''Trigger'' set to ''Once Per Bar Close''.
6. Save.
7. Wait for a signal to occur!
NOTE: Before placing a trade, it's often best to also assess the market conditions at that time also - and not rely solely on the signals, the signals are to assist, and it's often occurred a signal has shown, but a pull-back occurs, and a FVG in discount holds -- it's this FVG holding, accompanied by volume, that's the real entry, possibly.
Tip: For the cleanest results, use the indicator during the most active sessions and always check multi-time-frame trend alignment before entering trades. Good Luck! :)

Open Interest-RSI + Funding + Fractal DivergencesIndicator — “Open Interest-RSI + Funding + Fractal Divergences”
A multi-factor oscillator that fuses Open-Interest RSI, real-time Funding-Rate data and price/OI fractal divergences.
It paints BUY/SELL arrows in its own pane and directly on the price chart, helping you spot spots where crowd positioning, leverage costs and price action contradict each other.
1 Purpose
OI-RSI – measures conviction behind position changes instead of price momentum.
Funding Rate – shows who pays to hold positions (longs → bull bias, shorts → bear bias).
Fractal Divergences – detects HH/LL in price that are not confirmed by OI-RSI.
Optional Funding filter – hides signals when funding is already extreme.
Together these elements highlight exhaustion points and potential mean-reversion trades.
2 Inputs
RSI / Divergence
RSI length – default 14.
High-OI level / Low-OI level – default 70 / 30.
Fractal period n – default 2 (swing width).
Fractals to compare – how many past swings to scan, default 3.
Max visible arrows – keeps last 50 BUY/SELL arrows for speed.
Funding Rate
mode – choose FR, Avg Premium, Premium Index, Avg Prem + PI or FR-candle.
Visual scale (×) – multiplies raw funding to fit 0-100 oscillator scale (default 10).
specify symbol – enable only if funding symbol differs from chart.
use lower tf – averages 1-min premiums for smoother intraday view.
show table – tiny two-row widget at chart edge.
Signal Filter
Use Funding filter – ON hides long signals when funding > Buy-threshold and short signals when funding < Sell-threshold.
BUY threshold (%) – default 0.00 (raw %).
SELL threshold (%) – default 0.00 (raw %).
(Enter funding thresholds as raw percentages, e.g. 0.01 = +0.01 %).
3 Visual Outputs
Sub-pane
Aqua OI-RSI curve with 70 / 50 / 30 reference lines.
Funding visualised according to selected mode (green above 0, red below 0, or other).
BUY / SELL arrows at oscillator extremes.
Price chart
Identical BUY / SELL arrows plotted with force_overlay = true above/below candles that formed qualifying fractals.
Optional table
Shows current asset ticker and latest funding value of the chosen mode.
4 Signal Logic (Summary)
Load _OI series and compute RSI.
Retrieve Funding-Rate + Premium Index (optionally from lower TF).
Find fractal swings (n bars left & right).
Check divergence:
Bearish – price HH + OI-RSI LH.
Bullish – price LL + OI-RSI HL.
If Funding-filter enabled, require funding < Buy-thr (long) or > Sell-thr (short).
Plot arrows and trigger two built-in alerts (Bearish OI-RSI divergence, Bullish OI-RSI divergence).
Signals are fixed once the fractal bar closes; they do not repaint afterwards.
5 How to Use
Attach to a liquid perpetual-futures chart (BTC, ETH, major Binance contracts).
If _OI or funding series is missing you’ll see an error.
Choose timeframe:
15 m – 4 h for intraday;
1 D+ for swing trades.
Lower TFs → more signals; raise Fractals to compare or use Funding filter to trim noise.
Trade checklist
Funding positive and rising → longs overcrowded.
Price makes higher high; OI-RSI makes lower high; Funding above Sell-threshold → consider short.
Reverse logic for longs.
Combine with trend filter (EMA ribbon, SuperTrend, etc.) so you fade only when price is stretched.
Automation – set TradingView alerts on the two alertconditions and send to webhooks/bots.
Performance tips
Keep Max visible arrows ≤ 50.
Disable lower-TF premium aggregation if script feels heavy.
6 Limitations
Some symbols lack _OI or funding history → script stops with a console message.
Binance Premium Index begins mid-2020; older dates show na.
Divergences confirm only after n bars (no forward repaint).
7 Changelog
v1.0 – 10 Jun 2025
Initial public release.
Added price-chart arrows via force_overlay.

BSL & SSL - Liquidity Zones
BSL & SSL - Liquidity Zones
Indicator Description (for TradingView)
Concept
The BSL & SSL - Liquidity Zones indicator is a simple yet powerful visual tool that helps traders identify key liquidity zones in the market by tracking prominent highs and lows on the chart.
It is based on the concept that the Highest High (Buy Side Liquidity - BSL) and Lowest Low (Sell Side Liquidity - SSL) represent zones where stop-loss orders and pending orders accumulate — often attracting future price movements.
Purpose
This indicator helps traders spot hidden liquidity levels which may act as targets or potential reversal points. It is especially useful for traders who apply Smart Money Concepts (SMC) or institutional trading models.
Great for detecting potential stop hunts and understanding market structure shifts.
How It Works
The indicator calculates the Highest High and Lowest Low over a user-defined period (default: 20 candles).
When a new Higher High forms, it marks a new BSL.
When a new Lower Low forms, it marks a new SSL.
These zones are likely to attract price in the future — either as targets or traps.
Visualization
The indicator draws static horizontal lines (Stepline style) at BSL and SSL levels.
These lines remain in place until broken or a new level is formed.
Visual Labels enhance clarity:
🟢 Green Label → BSL
🔴 Red Label → SSL
Trading Insights / Practical Use
When price approaches a BSL or SSL zone, ask yourself:
✅ Will price break the level to grab liquidity?
✅ Will there be a reversal after liquidity is taken?
The indicator does not provide signals by itself — it serves as a valuable confirmation tool when combined with:
Price Action
Support & Resistance
Momentum Indicators
SMC Tools
Key Benefits
✅ Easy to use
✅ Enhances liquidity analysis
✅ Highlights zones targeted by institutional players
✅ Simple calculation — no complex formulas
Limitations
🚫 Does NOT generate buy/sell signals
🚫 Should be used as part of a complete trading framework
Conclusion
BSL & SSL - Liquidity Zones is a versatile and intuitive tool for any trader looking to better understand where liquidity is positioned on the chart.
It works across all timeframes and complements any trading strategy, especially Smart Money-based approaches.

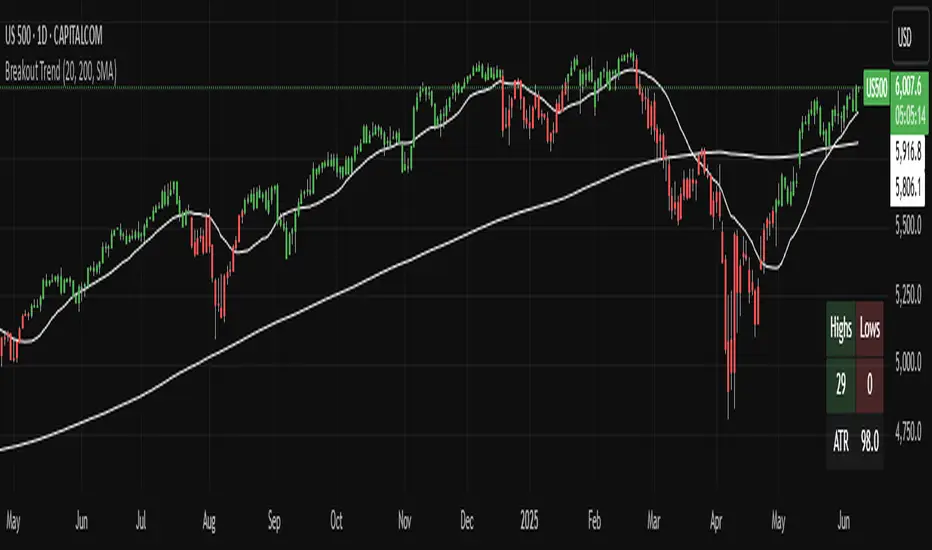
Breakout TrendTiltFolio Breakout Trend indicator
The Breakout Trend indicator is designed to help traders clearly visualize trend direction by combining two complementary techniques: moving averages and Donchian-style breakout logic.
Rather than relying on just one type of signal, this indicator merges short-term and long-term moving averages with breakout levels based on recent highs and lows. The moving averages define the broader trend regime, while the breakout logic pinpoints moments when price confirms directional momentum. This layered approach filters out many false signals while still capturing high-conviction moves.
Yes, these are lagging indicators by design — and that’s the point. Instead of predicting every wiggle, the Breakout Trend waits for confirmation, offering higher signal quality and fewer whipsaws. When the price breaks above a recent high and sits above the long-term moving average, the trend is more likely to persist. That’s when this indicator shines.
While it performs best on higher timeframes (daily/weekly), it's also adaptable to shorter timeframes for intraday traders who value clean, systematic trend signals.
For early signal detection, we recommend pairing this with TiltFolio’s Buying/Selling Proxy, which anticipates pressure buildups—albeit with more noise.
It's easy to read and built for real-world trading discipline.
RSI Buy Sell Signals+ with MFI Cloud [RanaAlgo]Indicator Overview
This indicator combines RSI (Relative Strength Index) with MFI (Money Flow Index) to generate trading signals with additional confirmation filters. The key features include:
RSI Analysis (14-period) with overbought/oversold levels
MFI Cloud (20-period default) showing trend direction via EMAs
Enhanced Signal Generation with volume and trend confirmation options
Visual Elements including colored zones, signal labels, and an information panel
How to Use This Indicator
Basic Interpretation:
Buy Signals (green labels) appear when:
RSI crosses above oversold level (30) OR
RSI shows a rising pattern from oversold zone with volume/trend confirmation (if enabled)
Sell Signals (red labels) appear when:
RSI crosses below overbought level (70) OR
RSI shows a falling pattern from overbought zone with volume/trend confirmation (if enabled)
MFI Cloud provides trend confirmation:
Green cloud = bullish trend (fast EMA > slow EMA)
Red cloud = bearish trend (fast EMA < slow EMA)
Recommended Usage:
For Conservative Trading:
Enable both volume and trend confirmation
Require MFI cloud to align with signal direction
Wait for RSI to clearly exit overbought/oversold zones
For Active Trading:
Combine with price action at key support/resistance levels
Watch for divergence between price and RSI
The Information Panel (top-right) shows:
Current RSI value and status
MFI trend direction
Last generated signal
Current momentum
Customization Options:
Adjust RSI/MFI lengths for sensitivity
Modify overbought/oversold levels
Toggle volume/trend confirmation requirements
Adjust visual elements like cloud opacity and zone visibility

LRCLRC (Linear Regression Candle)
Overview
The LRC (Linear Regression Candle) indicator applies linear regression to the open, high, low, and close prices, creating smoothed "candles" that help filter market noise. It provides trend-confirmation signals and highlights potential reversal points based on regression crossovers.
Key Features
Smoothed Candles: Uses linear regression to calculate synthetic OHLC values, reducing noise.
Multi-Timeframe Support: Optional higher timeframe analysis for better trend confirmation.
Visual Signals: Color-coded candles and labels highlight bullish/bearish control zones.
Customizable Settings: Adjustable regression length, colors, and timeframe options.
How to Use
Signals & Interpretation
🟢 Bullish Signal (BUY): When the regression open crosses above the regression close (green candle).
🔴 Bearish Signal (SELL): When the regression open crosses below the regression close (red candle).
Control Zones:
Strong Bullish (Controlbull): Confirmed uptrend (bright green).
Bullish (Bull): Regular uptrend (light green).
Strong Bearish (Controlbear): Confirmed downtrend (dark red).
Bearish (Bear): Regular downtrend (orange).
Neutral (Gray): No clear trend.
Recommended Settings
Linear Regression Length: Default 8 (adjust for sensitivity).
Timeframe: Default current chart, but can switch to higher timeframes (e.g., 1D, 1W).
Bar Colors: Toggle on/off for visual clarity.
Labels: Displays "Control" markers at key reversal points.
Example Use Cases
Trend Confirmation: Use higher timeframe LRC to validate the primary trend.
Reversal Signals: Watch for BUY/SELL crossovers with strong color confirmation.
Noise Reduction: Helps avoid false breakouts in choppy markets.

OpenAI Signal Generator - Enhanced Accuracy# AI-Powered Trading Signal Generator Guide
## Overview
This is an advanced trading signal generator that combines multiple technical indicators using AI-enhanced logic to generate high-accuracy trading signals. The indicator uses a sophisticated combination of RSI, MACD, Bollinger Bands, EMAs, ADX, and volume analysis to provide reliable buy/sell signals with comprehensive market analysis.
## Key Features
### 1. Multi-Indicator Analysis
- **RSI (Relative Strength Index)**
- Length: 14 periods (default)
- Overbought: 70 (default)
- Oversold: 30 (default)
- Used for identifying overbought/oversold conditions
- **MACD (Moving Average Convergence Divergence)**
- Fast Length: 12 (default)
- Slow Length: 26 (default)
- Signal Length: 9 (default)
- Identifies trend direction and momentum
- **Bollinger Bands**
- Length: 20 periods (default)
- Multiplier: 2.0 (default)
- Measures volatility and potential reversal points
- **EMAs (Exponential Moving Averages)**
- Fast EMA: 9 periods (default)
- Slow EMA: 21 periods (default)
- Used for trend confirmation
- **ADX (Average Directional Index)**
- Length: 14 periods (default)
- Threshold: 25 (default)
- Measures trend strength
- **Volume Analysis**
- MA Length: 20 periods (default)
- Threshold: 1.5x average (default)
- Confirms signal strength
### 2. Advanced Features
- **Customizable Signal Frequency**
- Daily
- Weekly
- 4-Hour
- Hourly
- On Every Close
- **Enhanced Filtering**
- EMA crossover confirmation
- ADX trend strength filter
- Volume confirmation
- ATR-based volatility filter
- **Comprehensive Alert System**
- JSON-formatted alerts
- Detailed technical analysis
- Multiple timeframe analysis
- Customizable alert frequency
## How to Use
### 1. Initial Setup
1. Open TradingView and create a new chart
2. Select your preferred trading pair
3. Choose an appropriate timeframe
4. Apply the indicator to your chart
### 2. Configuration
#### Basic Settings
- **Signal Frequency**: Choose how often signals are generated
- Daily: Signals at the start of each day
- Weekly: Signals at the start of each week
- 4-Hour: Signals every 4 hours
- Hourly: Signals every hour
- On Every Close: Signals on every candle close
- **Enable Signals**: Toggle signal generation on/off
- **Include Volume**: Toggle volume analysis on/off
#### Technical Parameters
##### RSI Settings
- Adjust `rsi_length` (default: 14)
- Modify `rsi_overbought` (default: 70)
- Modify `rsi_oversold` (default: 30)
##### EMA Settings
- Fast EMA Length (default: 9)
- Slow EMA Length (default: 21)
##### MACD Settings
- Fast Length (default: 12)
- Slow Length (default: 26)
- Signal Length (default: 9)
##### Bollinger Bands
- Length (default: 20)
- Multiplier (default: 2.0)
##### Enhanced Filters
- ADX Length (default: 14)
- ADX Threshold (default: 25)
- Volume MA Length (default: 20)
- Volume Threshold (default: 1.5)
- ATR Length (default: 14)
- ATR Multiplier (default: 1.5)
### 3. Signal Interpretation
#### Buy Signal Requirements
1. RSI crosses above oversold level (30)
2. Price below lower Bollinger Band
3. MACD histogram increasing
4. Fast EMA above Slow EMA
5. ADX above threshold (25)
6. Volume above threshold (if enabled)
7. Market volatility check (if enabled)
#### Sell Signal Requirements
1. RSI crosses below overbought level (70)
2. Price above upper Bollinger Band
3. MACD histogram decreasing
4. Fast EMA below Slow EMA
5. ADX above threshold (25)
6. Volume above threshold (if enabled)
7. Market volatility check (if enabled)
### 4. Visual Indicators
#### Chart Elements
- **Moving Averages**
- SMA (Blue line)
- Fast EMA (Yellow line)
- Slow EMA (Purple line)
- **Bollinger Bands**
- Upper Band (Green line)
- Middle Band (Orange line)
- Lower Band (Green line)
- **Signal Markers**
- Buy Signals: Green triangles below bars
- Sell Signals: Red triangles above bars
- **Background Colors**
- Light green: Buy signal period
- Light red: Sell signal period
### 5. Alert System
#### Alert Types
1. **Signal Alerts**
- Generated when buy/sell conditions are met
- Includes comprehensive technical analysis
- JSON-formatted for easy integration
2. **Frequency-Based Alerts**
- Daily/Weekly/4-Hour/Hourly/Every Close
- Includes current market conditions
- Technical indicator values
#### Alert Message Format
```json
{
"symbol": "TICKER",
"side": "BUY/SELL/NONE",
"rsi": "value",
"macd": "value",
"signal": "value",
"adx": "value",
"bb_upper": "value",
"bb_middle": "value",
"bb_lower": "value",
"ema_fast": "value",
"ema_slow": "value",
"volume": "value",
"vol_ma": "value",
"atr": "value",
"leverage": 10,
"stop_loss_percent": 2,
"take_profit_percent": 5
}
```
## Best Practices
### 1. Signal Confirmation
- Wait for multiple confirmations
- Consider market conditions
- Check volume confirmation
- Verify trend strength with ADX
### 2. Risk Management
- Use appropriate position sizing
- Implement stop losses (default 2%)
- Set take profit levels (default 5%)
- Monitor market volatility
### 3. Optimization
- Adjust parameters based on:
- Trading pair volatility
- Market conditions
- Timeframe
- Trading style
### 4. Common Mistakes to Avoid
1. Trading without volume confirmation
2. Ignoring ADX trend strength
3. Trading against the trend
4. Not considering market volatility
5. Overtrading on weak signals
## Performance Monitoring
Regularly review:
1. Signal accuracy
2. Win rate
3. Average profit per trade
4. False signal frequency
5. Performance in different market conditions
## Disclaimer
This indicator is for educational purposes only. Past performance is not indicative of future results. Always use proper risk management and trade responsibly. Trading involves significant risk of loss and is not suitable for all investors.

Kaufman Trend Strength Signal█ Overview
Kaufman Trend Strength Signal is an advanced trend detection tool that decomposes price action into its underlying directional trend and localized oscillation using a vector-based Kalman Filter.
By integrating adaptive smoothing and dynamic weighting via a weighted moving average (WMA), this indicator provides real-time insight into both trend direction and trend strength — something standard moving averages often fail to capture.
The core model assumes that observed price consists of two components:
(1) a directional trend, and
(2) localized noise or oscillation.
Using a two-step Predict & Update cycle, the filter continuously refines its trend estimate as new market data becomes available.
█ How It Works
This indicator employs a Kalman Filter model that separates the trend from short-term fluctuations in a price series.
Predict & Update Cycle : With each new bar, the filter predicts the price state and updates that prediction using the latest observed price, producing a smooth but adaptive trend line.
Trend Strength Normalization : Internally, the oscillator component is normalized against recent values (N periods) to calculate a trend strength score between -100 and +100.
(Note: The oscillator is not plotted on the chart but is used for signal generation.)
Filtered MA Line : The trend component is plotted as a smooth Kalman Filter-based moving average (MA) line on the main chart.
Threshold Cross Signals : When the internal trend strength crosses a user-defined threshold (default: ±60), visual entry arrows are displayed to signal momentum shifts.
█ Key Features
Adaptive Trend Estimation : Real-time filtering that adjusts dynamically to market changes.
Visual Buy/Sell Signals : Entry arrows appear when the trend strength crosses above or below the configured threshold.
Built-in Range Filter : The MA line turns blue when trend strength is weak (|value| < 10), helping you filter out choppy, sideways conditions.
█ How to Use
Trend Detection :
• Green MA = bullish trend
• Red MA = bearish trend
• Blue MA = no trend / ranging market
Entry Signals :
• Green triangle = trend strength crossed above +Threshold → potential bullish entry
• Red triangle = trend strength crossed below -Threshold → potential bearish entry
█ Settings
Entry Threshold : Level at which the trend strength triggers entry signals (default: 60)
Process Noise 1 & 2 : Control the filter’s responsiveness to recent price action. Higher = more reactive; lower = smoother.
Measurement Noise : Sets how much the filter "trusts" price data. High = smoother MA, low = faster response but more noise.
Trend Lookback (N2) : Number of bars used to normalize trend strength. Lower = more sensitive; higher = more stable.
Trend Smoothness (R2) : WMA smoothing applied to the trend strength calculation.
█ Visual Guide
Green MA Line → Bullish trend
Red MA Line → Bearish trend
Blue MA Line → Sideways/range
Green Triangle → Entry signal (trend strengthening)
Red Triangle → Entry signal (trend weakening)
█ Best Practices
In high-volatility conditions, increase Measurement Noise to reduce false signals.
Combine with other indicators (e.g., RSI, MACD, EMA) for confirmation and filtering.
Adjust "Entry Threshold" and noise settings depending on your timeframe and trading style.
❗ Disclaimer
This script is provided for educational purposes only and should not be considered financial advice or a recommendation to buy/sell any asset.
Trading involves risk. Past performance does not guarantee future results.
Always perform your own analysis and use proper risk management when trading.
